Rfid Technology Empowers Various Industries
 2026-11-12
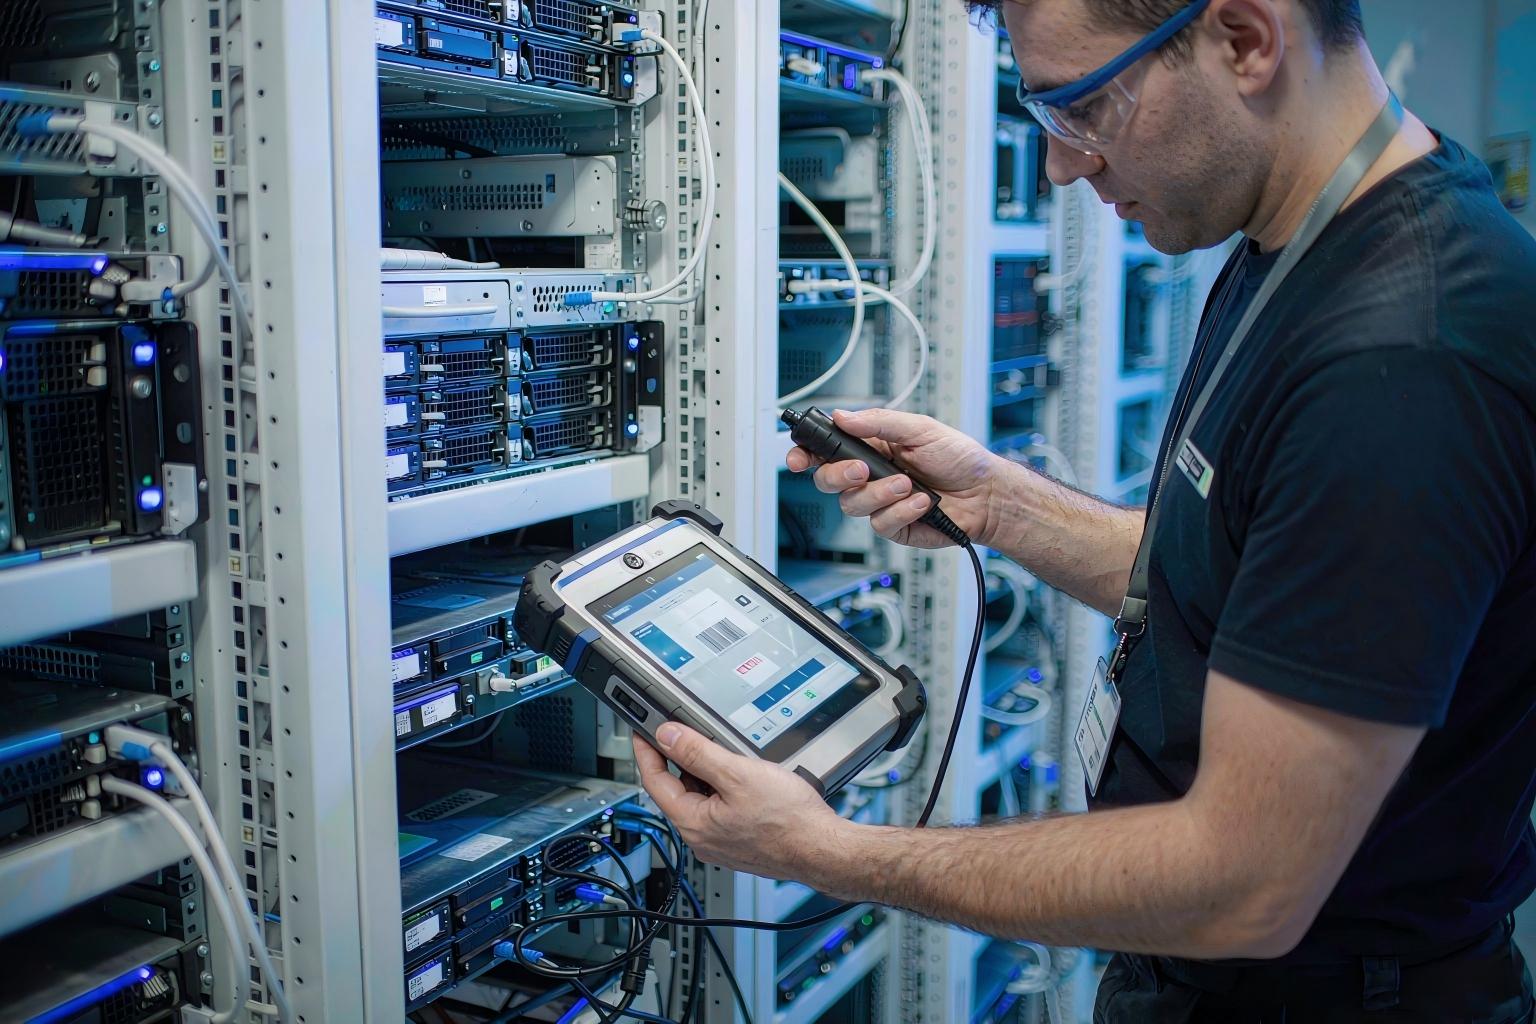
Fig. 1 — A handheld UHF reader verifies hundreds of tagged assets per sweep — no cabinet opening, no line-of-sight scanning.
UHF RFID asset management attaches a passive tag to every asset and instruments the spaces it travels through. Passive UHF tags are read without line of sight and in batches — hundreds per second — so audits become fast sweeps and fixed portals record asset movements automatically.
Headline outcomes observed across deployments:
• Audit speed: a 5,000-asset site that took 3 auditors 2 weeks by barcode takes 2 people half a day with handheld RFID sweeps
• Ledger accuracy: 70–85% typical barcode-era accuracy rises to 99%+, maintained continuously
• Loss prevention: door portals catch unauthorized removals in real time — lost/missing assets typically cut 60–80% in year one
• Audit effort cost: 70–90% reduction in audit labor hours, shorter year-end physical inventory
• Lifecycle data: every movement, handover and maintenance event tied to a verified asset ID
Typical payback for a 5,000-asset enterprise site is 12–20 months, driven by audit labor savings, loss reduction and finance reconciliation effort. A detailed ROI model is provided in Section 11.
Barcode audits require finding and scanning each asset one at a time. Audit teams skip or sample; the verified ledger is out of date the day after the audit ends.
Finance carries assets that were scrapped or relocated years ago; write-offs at disposal time become disputed because the asset cannot be located.
Laptops travel between branches, tools ride in service vans — none of these movements enter the system of record, so last-known-location is a guess.
Untracked spares, duplicate purchases of assets that exist but cannot be found, and unreturned loaners are chronic cost drains barcodes cannot see.
Growth multiplies audit labor linearly; spreadsheets and labels cannot provide the real-time accountability finance, security and compliance teams now expect.

Fig. 2 — A doorway portal records which tagged assets left the equipment room, with whom and when — automatically.
Four candidate technologies compete for asset identification. UHF passive RFID is the only one that combines batch reading, no line of sight, no battery and a per-item electronic identity.
Technology | Read mode | Asset fit | Limits |
Barcode / QR label | One at a time, line of sight | Cheap but manual | Slow audits, no batch reading, hidden labels |
QR + manual logging | Scan + app entry | Better data capture | Still per-item; staff discipline; no automatic events |
Active RTLS (beacon) | Continuous, 10–100 m | Real-time location | $15–50 per tag, 2–4 year batteries, overkill for most needs |
UHF passive RFID (EPC Gen2) | Batch, 200+ tags/sec, no line of sight | Excellent | Needs tag selection per material, portal engineering |
• Batch auditing — handheld sweeps read 200+ tags per second through cabinet doors, rack fronts and cardboard
• No battery, 5–10 year life — passive tags are maintenance-free across the asset lifecycle; many cost under $1
• Automatic movement events — door portals capture check-in/check-out and room-to-room moves without human action
• Tamper and clone resistance — TID-locked tags cannot be re-encoded; tamper-evident designs tear on removal
• Open standard — EPC Gen2 hardware is multi-vendor with proven field reliability
Design note: assets are hostile RF environments — metal chassis, dense racks and liquids detune ordinary tags. Tag selection per asset class (Section 5) is the single most important success factor.
The solution follows the standard four-layer RFID architecture, tuned for asset workflows.
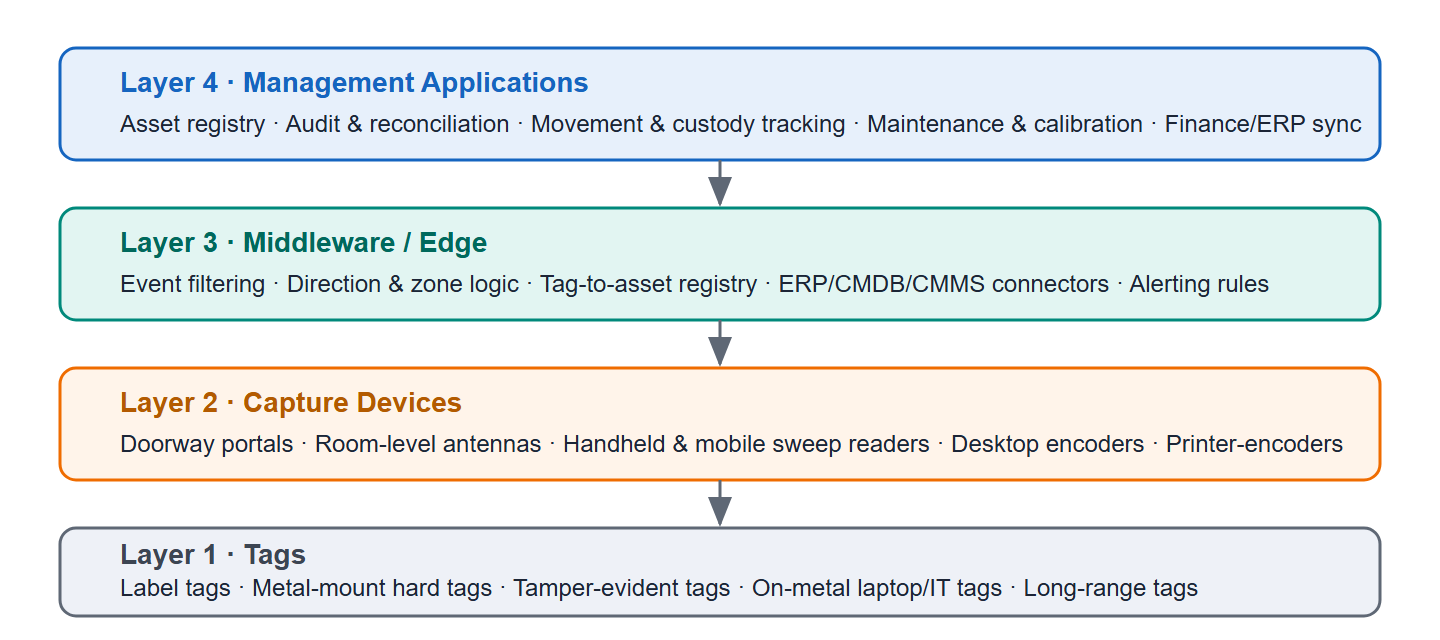
Fig. 3 — Four-layer architecture: tags → capture devices → edge middleware → management applications.
• Tags: each asset carries one EPC Gen2 tag encoding a unique Asset ID; the registry maps EPC ⇄ asset number ⇄ owner ⇄ location
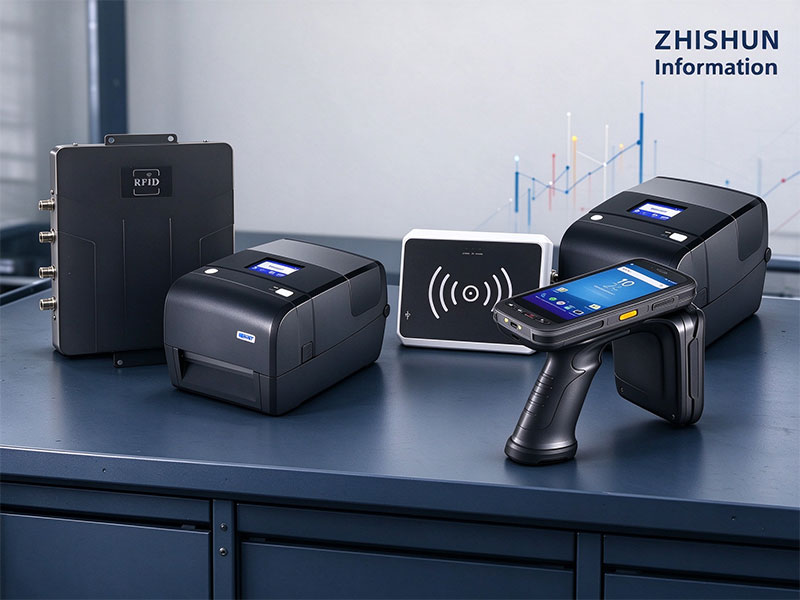
• Capture devices: door portals, room-level ceiling antennas, handheld sweep readers, and printer-encoders that print + encode in one pass
• Middleware: filters duplicates, resolves direction and zone transitions, maintains the registry, exposes ERP/CMDB/CMMS connectors
• Applications: asset registry with movement history, audit and reconciliation, custody tracking, maintenance/calibration, finance reporting
Data rule: the tag carries only a site-scoped Asset ID; personal and financial data stay in the registry — simpler privacy compliance and tag replacement.
Assets span every RF condition: bare metal chassis, dense racks, wooden furniture, liquid-filled equipment. The tag portfolio matches tag physics to each asset class.
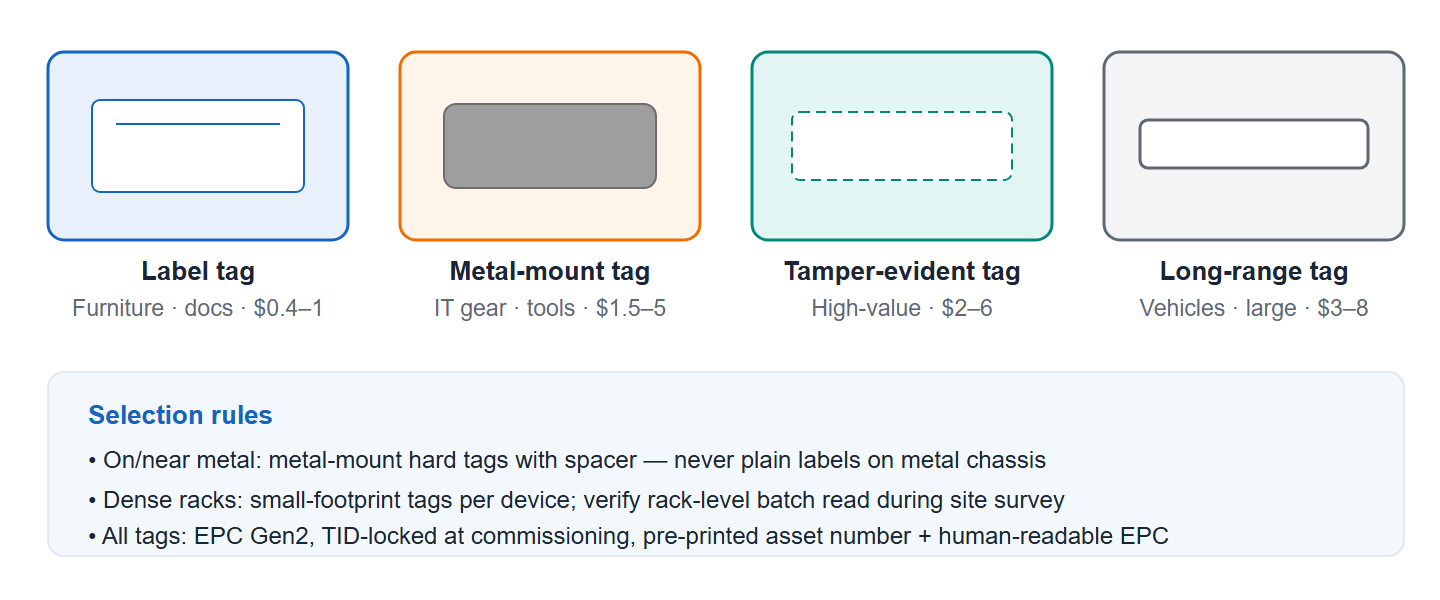
Fig. 4 — Four tag classes and the asset categories each serves.
Tag class | Typical assets | Read range | Unit cost |
Label / sticker tag | Furniture, boxes, documents, monitors | 3–6 m | $0.4–1.0 |
Metal-mount hard tag | Servers, laptops (on-metal), machines, tools | 2–6 m | $1.5–5.0 |
Tamper-evident tag | High-value IT, medical devices, test equipment | 2–5 m | $2–6 |
Long-range / large tag | Vehicles, returnable pallets, large equipment | 6–10 m | $3–8 |
✓ Encode only a site-scoped Asset ID in EPC memory; keep owner, cost and location data in the registry
✓ Print label + encode EPC in one pass with a printer-encoder; human-readable asset number on every tag
✓ TID-lock the tag at commissioning; reserve kill commands for the disposal workflow only
✓ Photograph asset + tag placement during commissioning — placement photos resolve 90% of later read questions
✓ Retire tag together with asset: disposal workflow kills the tag and archives the EPC
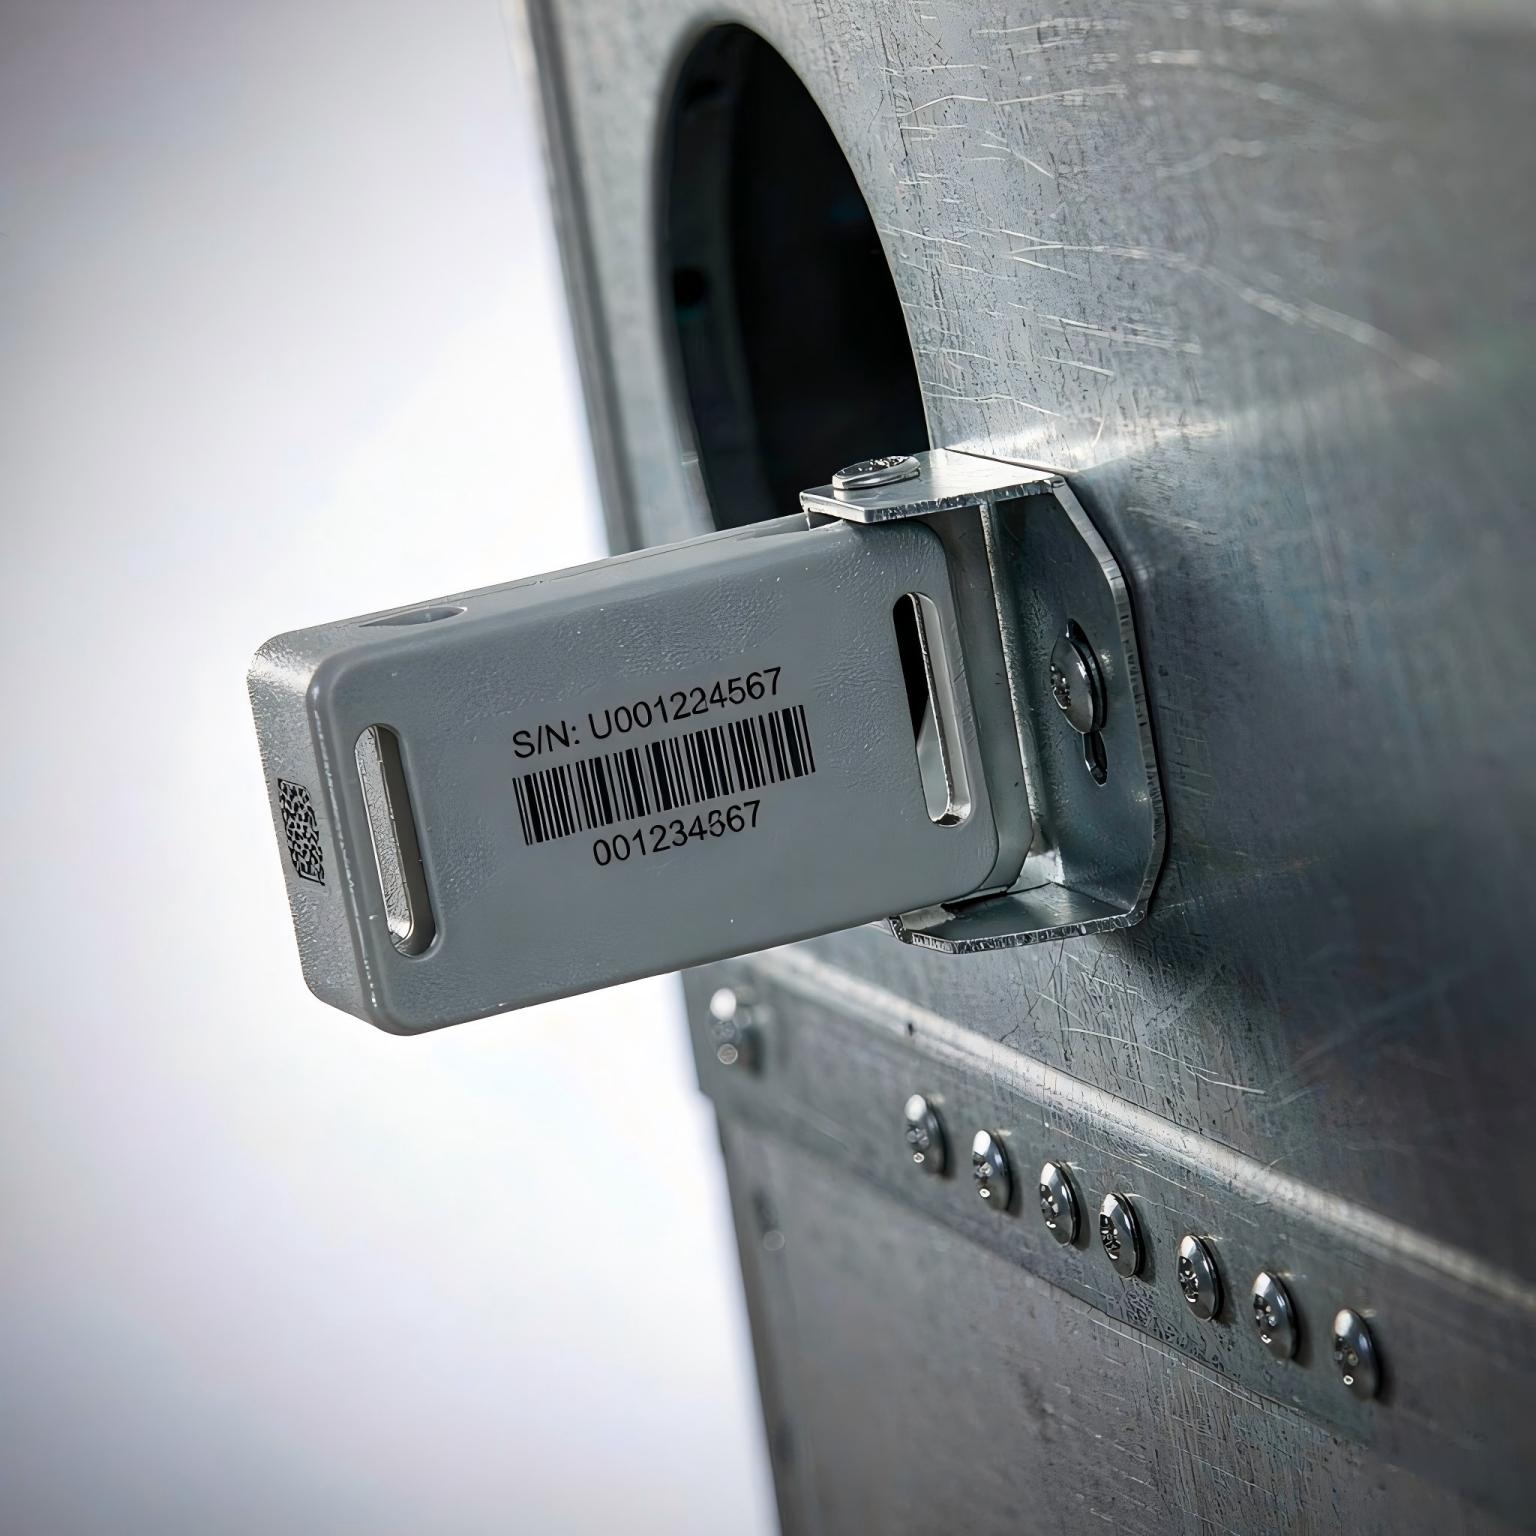
Fig. 5 — A metal-mount hard tag: engineered to read reliably on steel chassis where plain labels fail.
Assets move through doors, elevators and storage areas. The deployment instruments those choke points — plus handheld sweeps for audits.
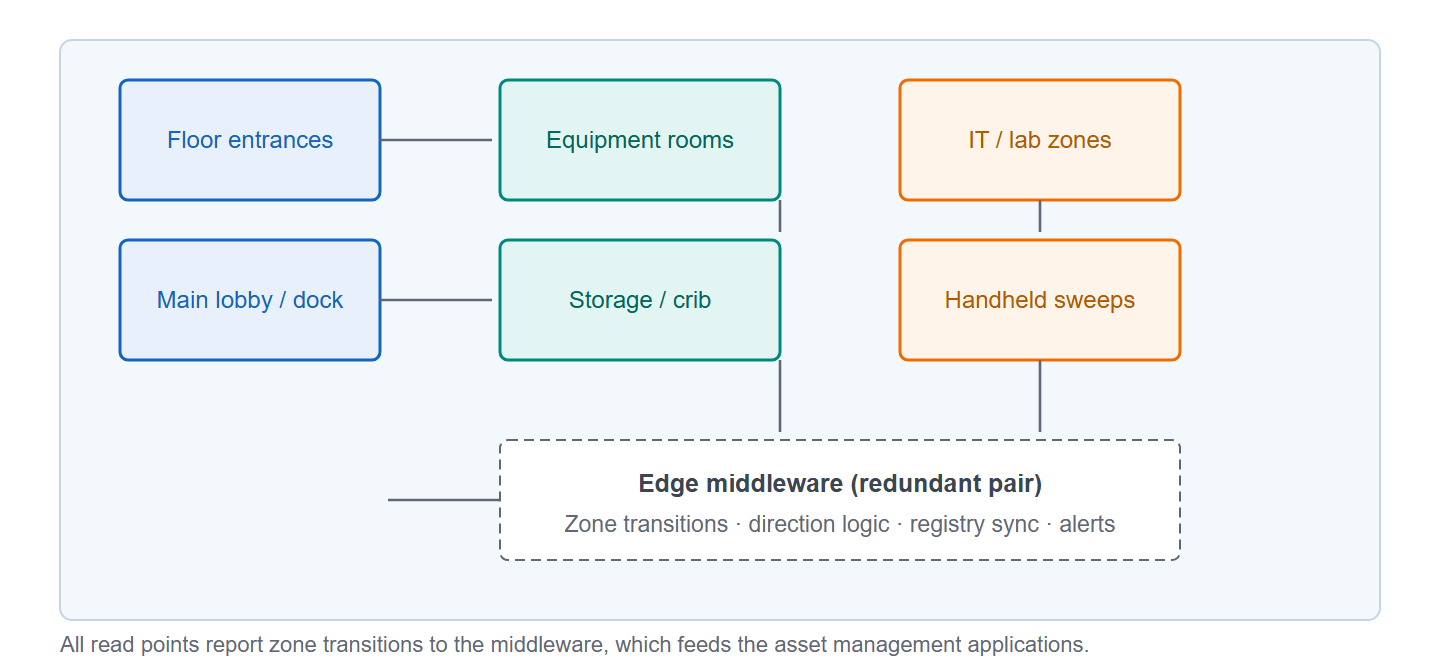
Fig. 6 — Typical site read-point map: entrances, equipment rooms, storage areas and sweep zones.
Read point | Reader / antennas | What it captures | Integration |
Doorway portals (equipment rooms, storage, floors) | 2 panel antennas flanking the door, 1–2 port reader; 3–4 m zone | Every tagged asset crossing the door, with direction and timestamp | Movement log; unauthorized-move alerts; door indicator |
Room-level zones (IT, labs, high-value) | 2–4 ceiling antennas, one reader | Presence inside the zone; exit events | Real-time inventory per room; tamper and after-hours alarms |
Receiving / shipping dock | 4-port reader, antenna pair per lane | Asset shipments and returns in batch | ERP goods movements; transfer orders |
Handheld sweeps | Handheld UHF readers (2–4 units) | Full-building audits, targeted geiger-mode searches | Audit app on device; sync to registry |
Desktop / printer-encoder | Encoder station in IT or asset office | Tag commissioning: print + encode + registry entry | Asset registry; ERP master data |

Fig. 7 — Office audits become a walk-through: an entire floor of laptops and monitors verified in minutes.
• Portal zones: read zone limited to 1–2 m beyond the door plane to avoid reading assets that merely walk past
• Dense environments: server racks and tool cribs tested at real density during the survey — batch read is verified, not assumed
• Interference: wireless APs, metal doors and displays mapped during survey; channel plans per region (FCC/ETSI)
• Direction logic: two antennas per doorway + time-difference of reads; ambiguous events flagged for review, not guessed
• Fallback: portals are event sources, not gatekeepers — a reader outage loses visibility on one door, never blocks operations
One tag identity drives six operational workflows, each described as trigger → system action → outcome.
Trigger: new asset received or legacy asset found during the initial audit. The printer-encoder prints the label and encodes the Asset ID; the registry entry is created with owner, cost center, location and photo. Every asset enters service already tracked.
Trigger: scheduled sweeps (quarterly or monthly) plus continuous portal events. Sweep results reconcile against the ledger; differences are classified as misplaced, unrecorded move, or missing — each generating a task with photo and last-known-location. Outcome: 99%+ ledger accuracy sustained year-round.
Trigger: tagged asset crosses a portal, or custody transfers in the app. Zone transitions are recorded, custody chains maintained, and inter-cost-center transfers post automatically. “Who has what, where is it now” is answered from data.
Trigger: a high-value asset crosses a portal without an approved move order. A real-time alert with asset photo, last reader and direction goes to security and the owner — organizations typically cut missing assets 60–80% in year one.
Trigger: equipment enters a service bay or a due date approaches. The CMMS opens the equipment's history; calibration certificates link to the verified asset ID — compliance evidence tied to physical items, not possibly-wrong ledger entries.
Trigger: asset approved for retirement. The disposal workflow verifies the physical asset by RFID read, kills the tag, archives the record and posts the ERP write-off — no more “scrapped on paper, alive in the ledger” discrepancies.
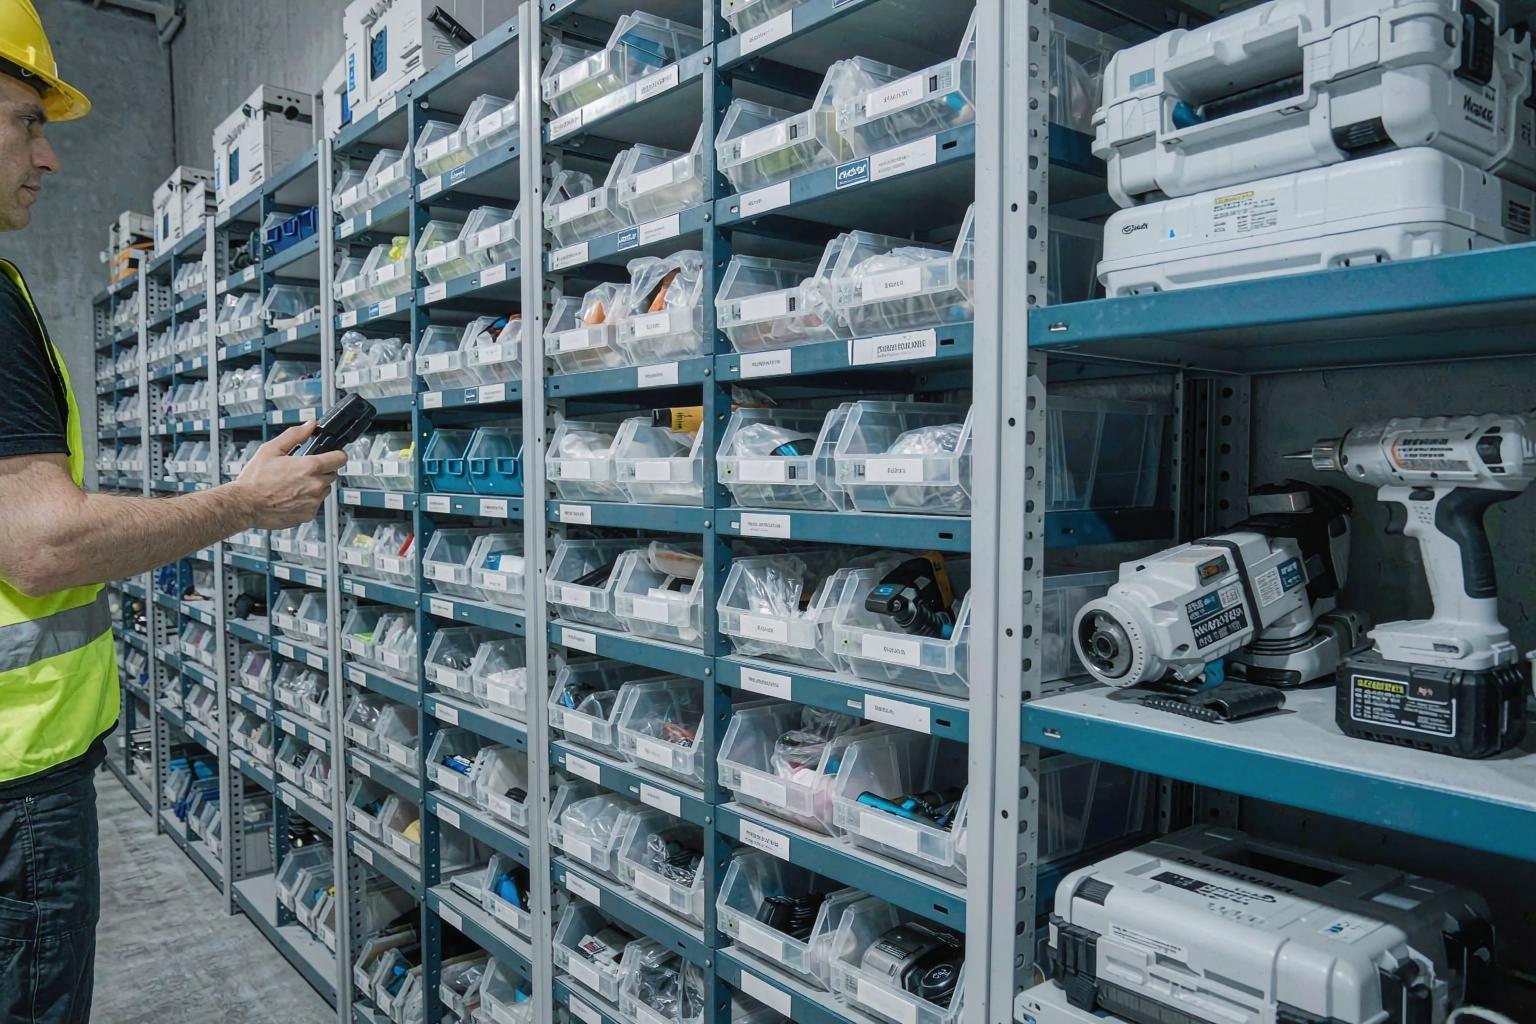
Fig. 8 — Tool cribs and storage rooms: shelf-level batch reads verify hundreds of items without touching them.
Scenario | Primary read points | Key value |
Enterprise IT assets | Floor portals, IT room zones, sweeps | Laptop ledger accuracy, offboarding custody clears, loss prevention |
Data center | Rack sweeps, room zones, door portals | Rack inventory in minutes, compliance audits, decommission control |
Manufacturing / tool crib | Crib portals, shelf sweeps, calibration bench | Tool availability, loss reduction, calibration compliance |
Healthcare | Department portals, equipment room zones | Equipment availability at point of care, preventive maintenance, recalls |
Utilities / field services | Warehouse portals, van sweeps | Van stock accuracy, equipment returned from jobs, deployment records |
Government / education | Building entrances, storage rooms, sweeps | Public asset accountability, audit compliance, budget defense |
• ERP / finance (SAP, Oracle, Kingdee, UFIDA): asset master import; disposal and transfer postings via API; RFID supplies verified physical state
• ITSM / CMDB (ServiceNow, Jira): laptop and server CI records bind to tag EPCs; audit deltas raise reconciliation tasks
• CMMS / maintenance: equipment history and calibration schedules keyed to Asset ID events
• Security / access control: portal alerts route to the PSIM; badge + asset events correlate (who carried what out)
• Data warehouse: normalized event stream (EPC, zone, direction, timestamp) retained 3–5 years for audit evidence
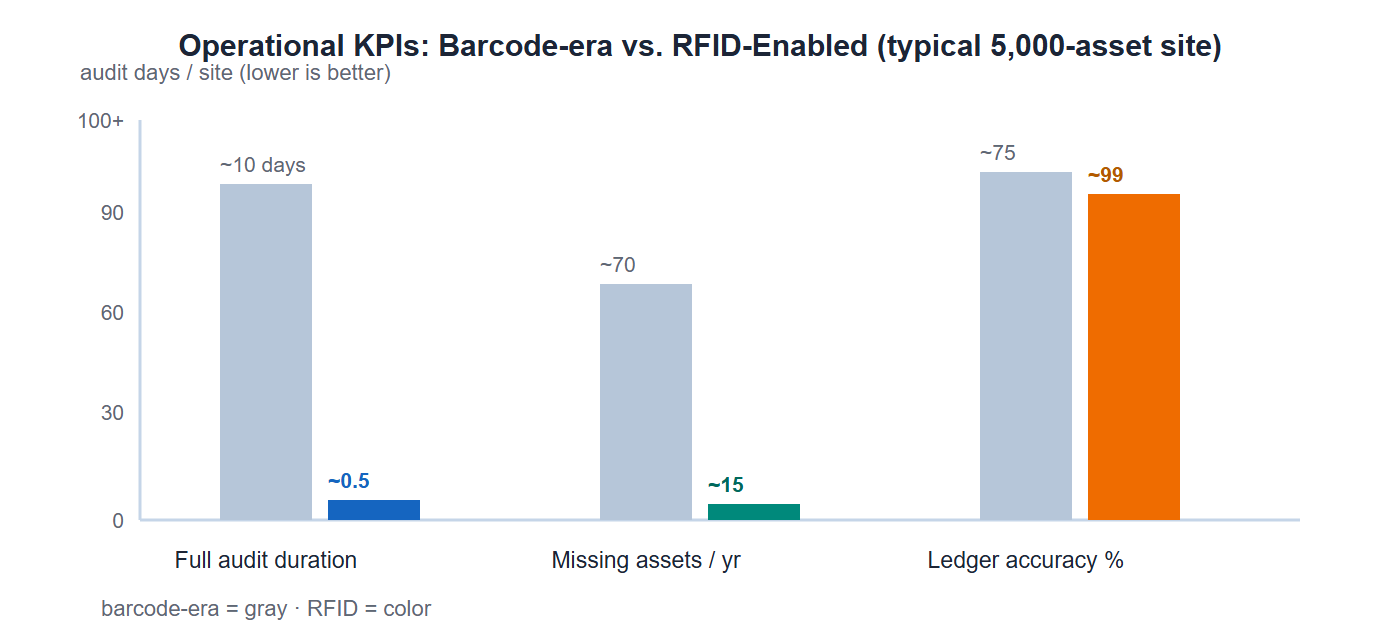
Fig. 9 — Typical KPI movement after RFID enablement (illustrative, calibrated from published deployment ranges).
KPI | Barcode era | UHF RFID target |
Full-site audit duration (5,000 assets) | 5–15 days, 2–3 people | 0.5–1 day, 1–2 people |
Ledger accuracy (physical vs. books) | 70–85% | ≥ 99% |
Missing / unlocatable assets per year | 1–2% of fleet | < 0.3% |
Asset movement records | Manual, sparse | 100% at instrumented doors |
Search time for a specific asset | 30–90 min | < 5 min (geiger-mode locate) |
Year-end inventory effort | Weeks, business disruption | Days, no disruption |
Disposal reconciliation disputes | Frequent | Rare — verified by RFID read |
Reference model: an enterprise headquarters with 5,000 tagged assets (2,000 IT assets, 1,500 tools/equipment, 1,500 furniture/fixtures), 6 instrumented doorways, 3 handheld readers.
Item | Qty | Unit cost | Subtotal |
Fixed readers + portal antennas (6 doors) | 6 sets | $2,800 | $16,800 |
Room-zone readers + ceiling antennas (2 zones) | 2 sets | $3,200 | $6,400 |
Handheld UHF readers | 3 | $1,900 | $5,700 |
Printer-encoder station | 1 | $2,500 | $2,500 |
Middleware licenses + server | 1 | $9,000 | $9,000 |
Integration (ERP/ITSM/CMMS connectors) | site | — | $10,000 |
Tags: 5,000 mixed-class + replenishment | — | avg $2.0 | $10,000 |
Total initial investment | ≈ $60,400 | ||
Annual running cost (support, tags, connectivity) | ≈ $4,500 |
• Audit labor savings: ≈ $18,000/yr (20 audit-days eliminated)
• Loss reduction: 55 fewer missing assets at $600 avg ≈ $33,000/yr (conservative first year: $18,000)
• Finance reconciliation effort: $9,000/yr
• Tool/equipment availability: fewer duplicate purchases ≈ $7,000/yr
Total annual benefit ≈ $52,000 (conservative) → payback ≈ 12–20 months. Sensitivity: payback is driven by asset count and audit frequency, average asset value and loss rate, and the number of instrumented doorways. Compliance-heavy sites (medical, aviation) typically pay back faster because audit evidence is mandated.
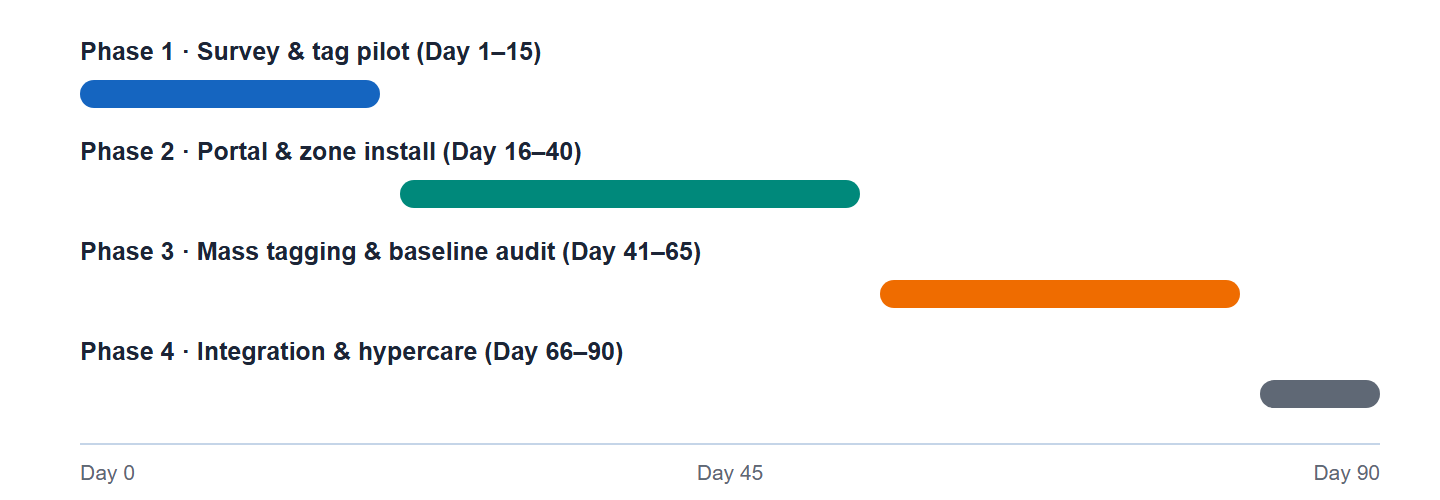
Fig. 10 — Four phases, 90 days to full operation.
Phase | Days | Key activities | Exit criteria |
1. Survey & tag pilot | 1–15 | RF site survey; asset-class inventory; tag selection tests on 100 sample assets (metal, dense, liquid) | Signed tag-per-class matrix; pilot batch read rate ≥ 99% |
2. Portal & zone install | 16–40 | Install 6 door portals + 2 room zones; tune direction logic; middleware pair live | Portal direction accuracy ≥ 98% on 500 crossings; false alerts < 1/day |
3. Mass tagging & baseline | 41–65 | Tag 5,000 assets; run baseline full audit; reconcile ledger | ≥ 98% of assets tagged; baseline audit accuracy ≥ 99% |
4. Integration & hypercare | 66–90 | ERP/ITSM/CMMS connectors live; alert policies tuned; dashboards; 2-week hypercare | All workflows live; KPI baseline captured; handover |
Risk | Mitigation |
Tags fail to read on metal or dense racks | Tag-per-class matrix validated in Phase 1; metal-mount tags with spacers; rack-level batch tests at real density |
Portal false alerts (neighbor reads, walk-past) | Read zones trimmed to the door plane; direction logic with ambiguity flagging; threshold tuning in hypercare |
Tag damage or removal | Tamper-evident designs on high-value assets; commissioning photos; replenishment stock (2–3%/yr modeled) |
Registry data quality | Single registry as source of truth; ERP sync with reconciliation report; dead-EPC cleanup after mass tagging |
Reader outage | Redundant middleware; events are additive, not blocking; spare-reader pool; weekly golden-tag zone tests |
Privacy / employee data concerns | Tags on assets, never on people; only site-scoped Asset IDs on tags; custodianship data under role-based access |
Ongoing operations: a site health dashboard tracks portal uptime, read rates and alert volumes; a weekly golden-tag walk verifies each instrumented zone in under 10 minutes. Data retention follows local regulations (3–5 years typical for audit evidence; personal data confined to the registry with role-based access).
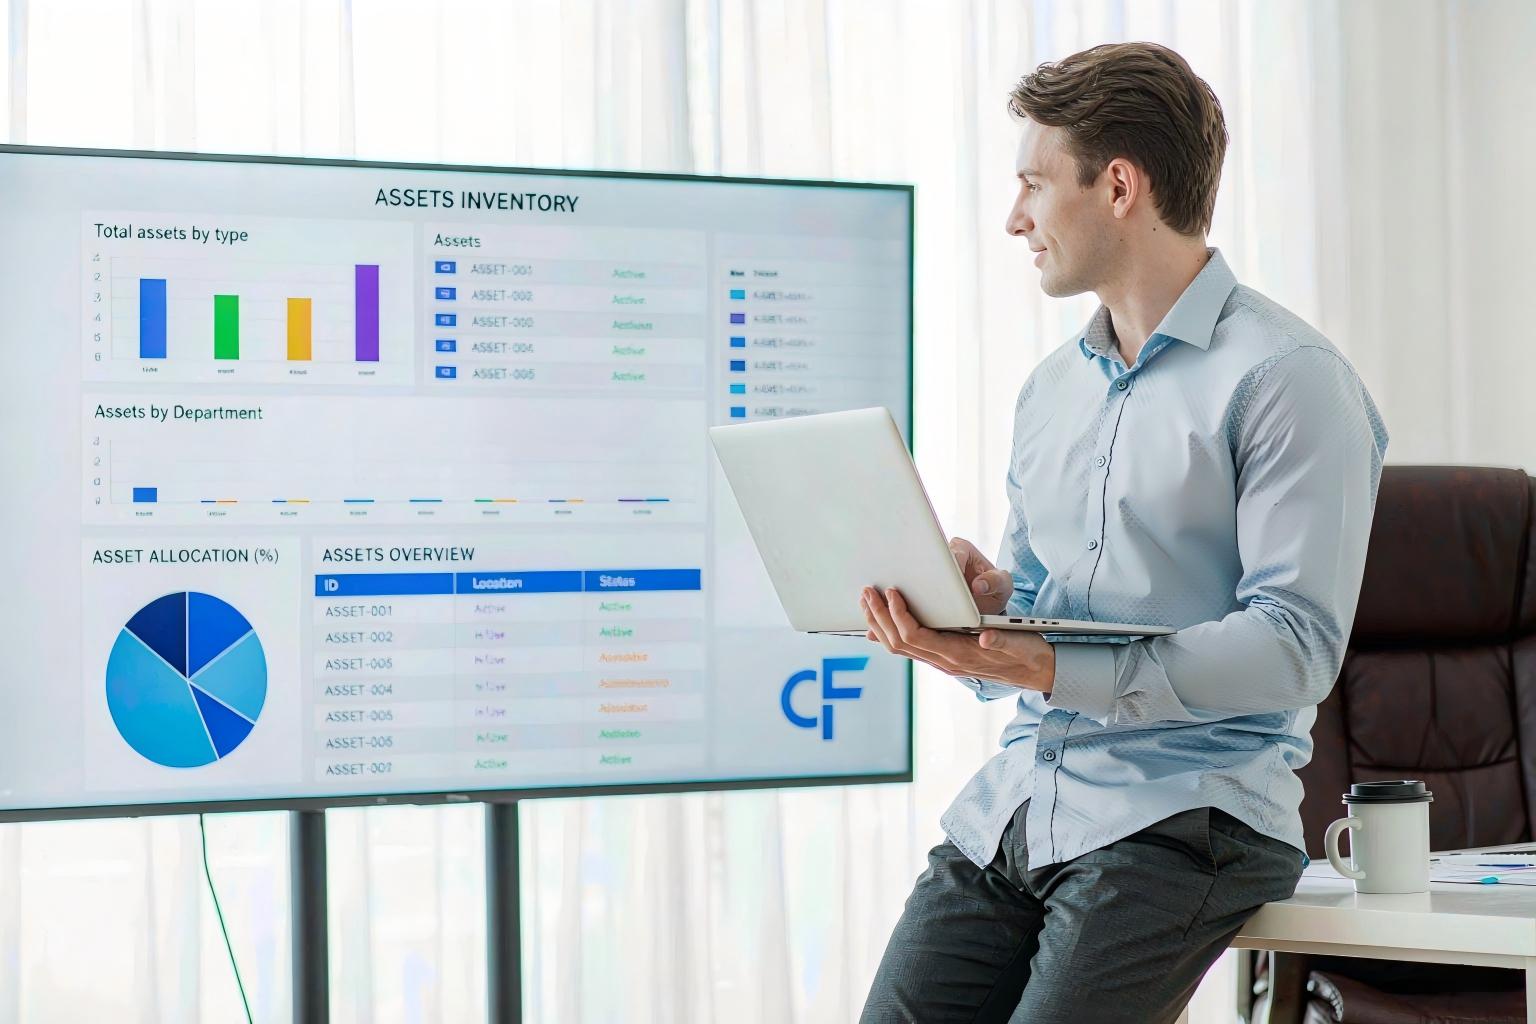
Fig. 11 — The end state: one live view of asset presence, movement history, audit status and exceptions.
Not with plain labels — but dedicated metal-mount hard tags (with built-in spacers) read reliably on steel chassis, servers and machines. Tag-per-class validation during Phase 1 is a mandatory exit criterion in this plan.
A handheld sweep reads 200+ tags per second without line of sight. Field results: a 5,000-asset site audits in half a day to one day with 1–2 people, versus 5–15 days for barcode methods.
Portals record the asset event with direction and timestamp. When portals are paired with badge access control, the middleware correlates badge and asset events to attribute custody — configured in Phase 4 integration.
RTLS beacons give continuous real-time location but cost $15–50 per tag and need battery replacement. UHF passive RFID gives event-based location and on-demand sweeps at under $5 per tag — the right economics for fixed-asset accountability. RTLS can be added later for the few assets that truly need live tracking.
Passive tags last 5–10 years with no battery. Annual replenishment of 2–3% of the fleet (damage, removal, new assets) is modeled in the running cost.
No — it complements it. The ERP remains the financial system of record; RFID supplies verified physical state (presence, location, movement, disposal confirmation). Disposal postings and transfers sync back to ERP automatically.
Ready to Make Every Asset Findable?
This plan converts asset management from periodic manual audits into a continuous, verified record. Start with a 2-week pilot: one floor, 200 assets, one portal — exit criteria of ≥ 99% batch read accuracy and a full pilot-floor audit in under 30 minutes before scaling site-wide.

Scan To Add

Scan To Add
Copyright © 2026 Shenzhen Zhishun Information Technology Co., Ltd All Rights Reserved.
Technical Support:SYSX





 182-7997-4925

 Home